Text size
Line height
Text spacing
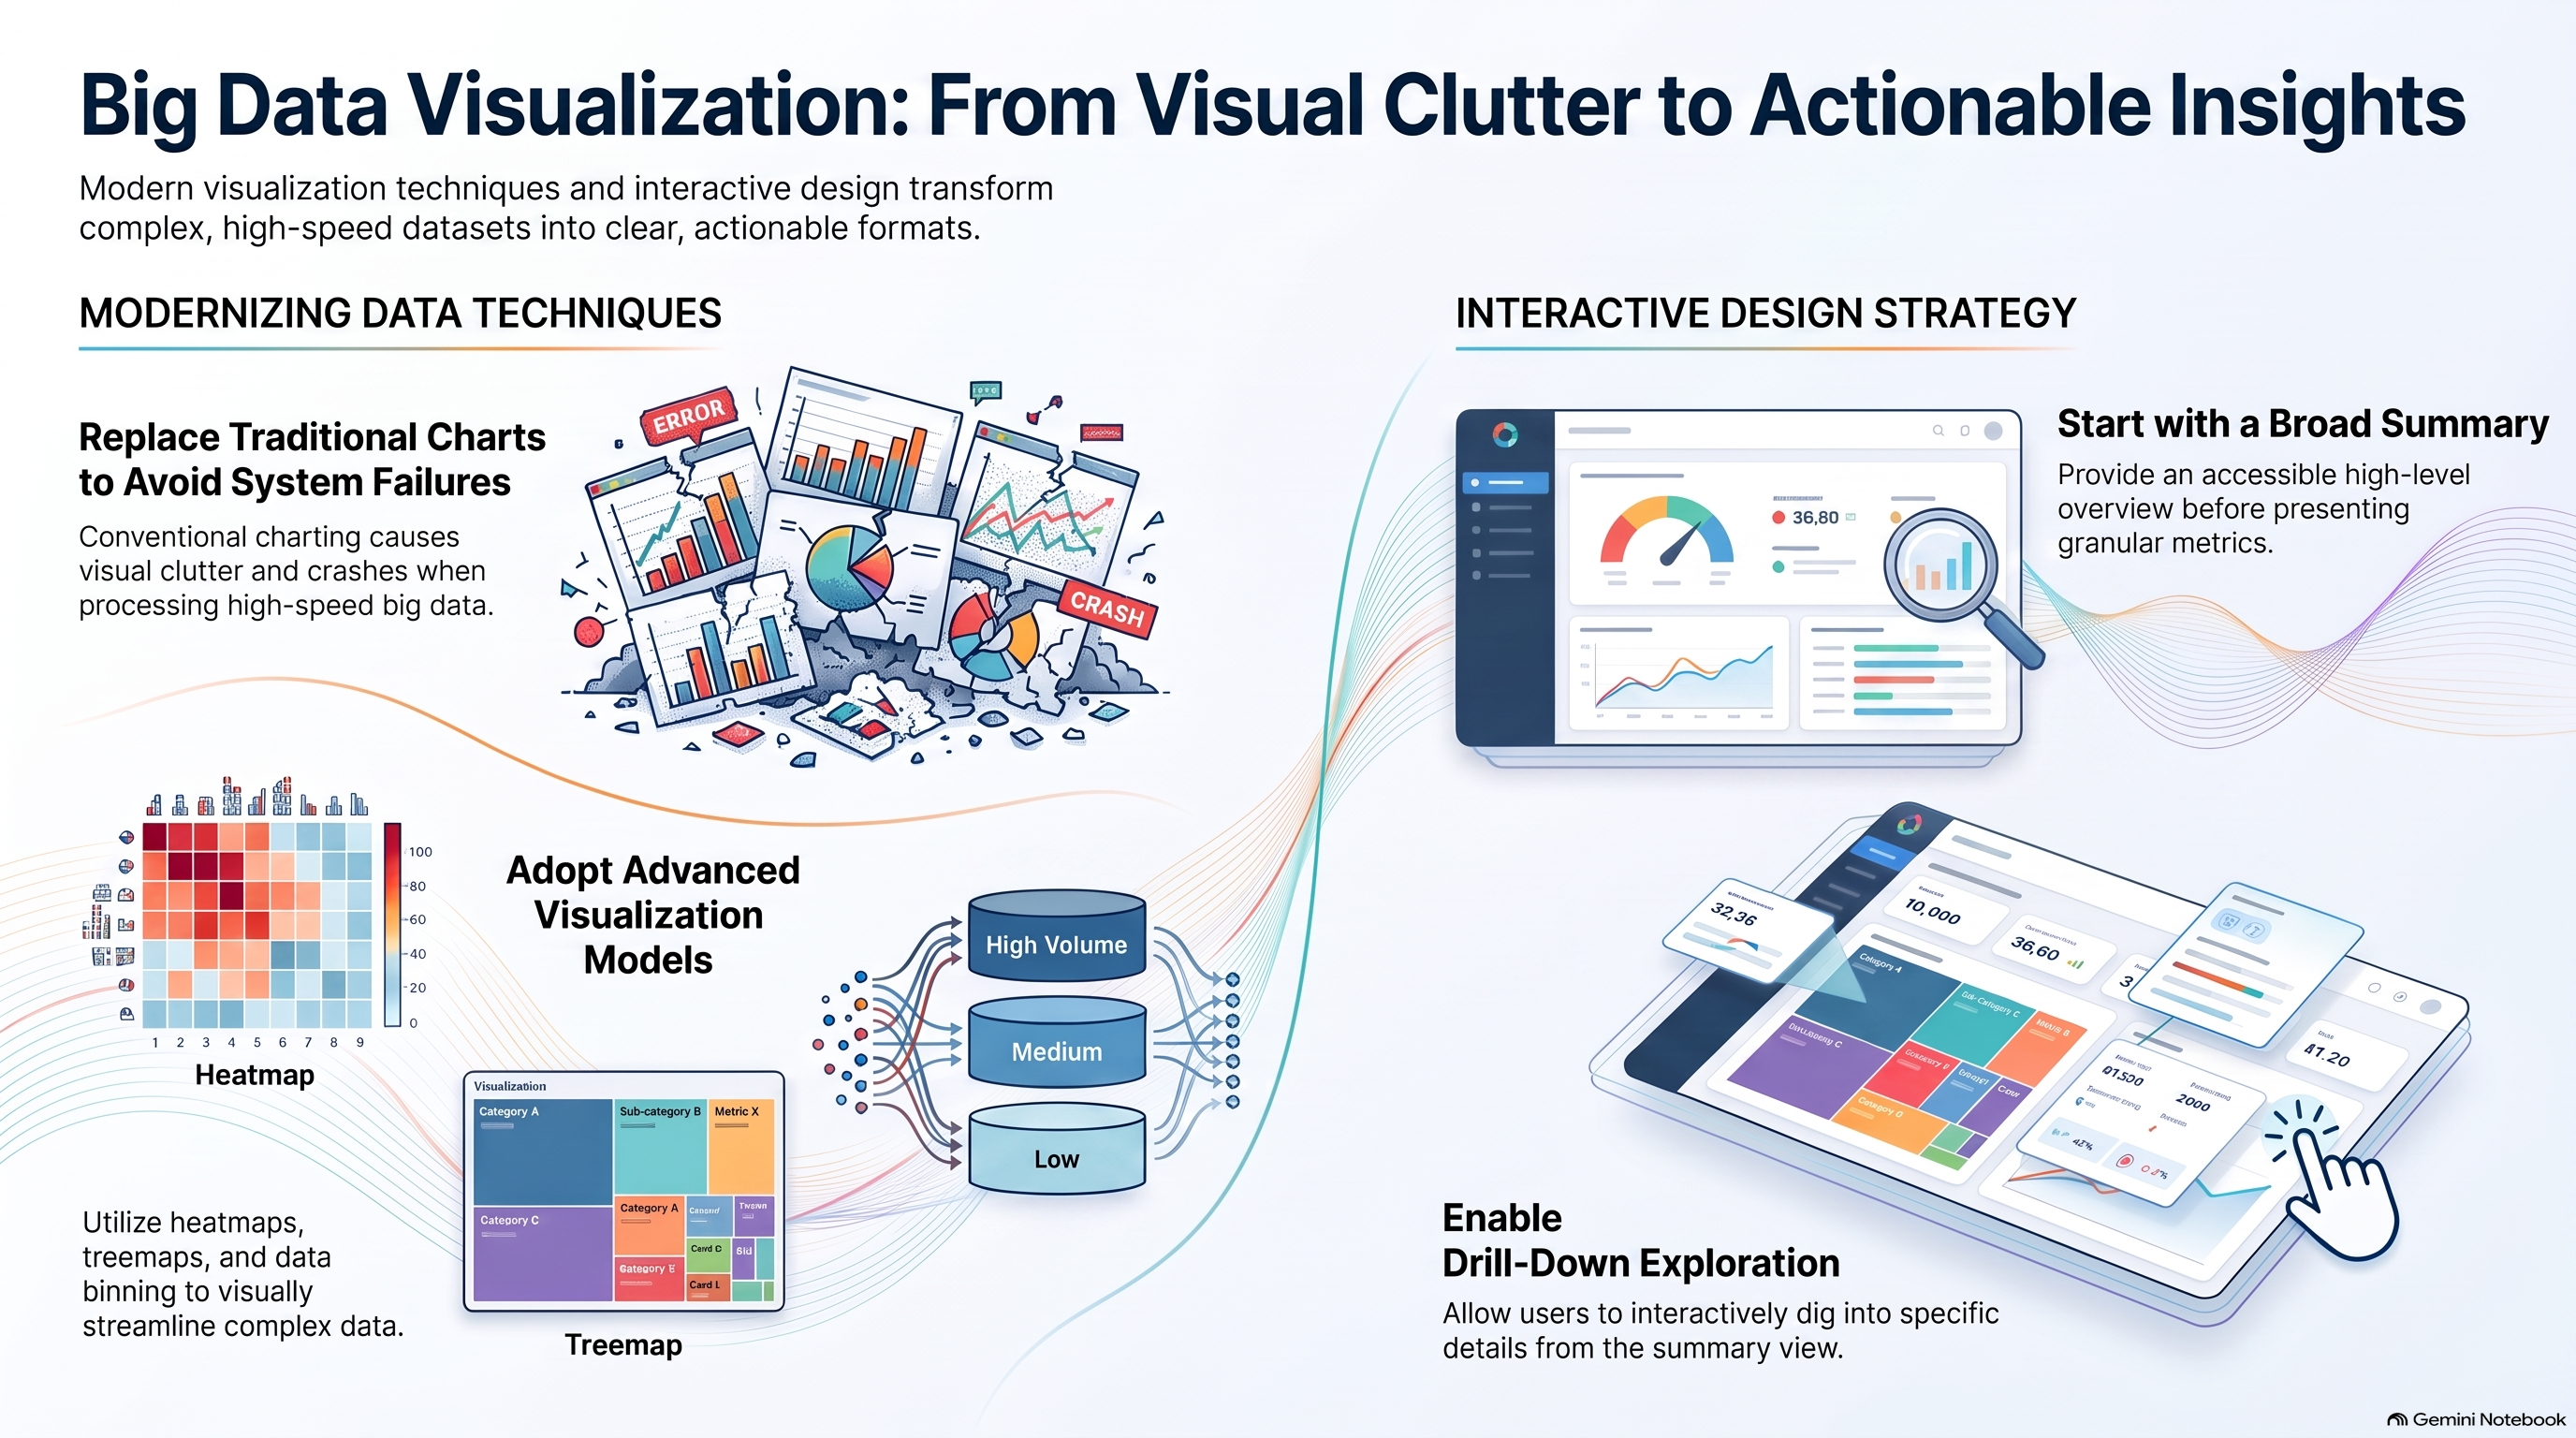
Here we explore the essential role of Big Data Visualization in converting overwhelming, high-speed datasets into actionable graphical formats. It emphasizes that traditional charting methods must be replaced by advanced techniques like heatmaps, treemaps, and data binning to prevent visual clutter and system crashes. The source highlights the importance of interactive design, allowing users to start with a broad summary before drilling down into specific details.
In a big data environment, data visualization is not just about making pretty charts; it is about building an efficient processing pipeline that transforms chaotic, high-volume raw data into clear, actionable business or operational intelligence.
In this assignment, you will act as an independent Data Architect and Analytics Consultant. You will select a raw big data domain, define the core questions the data needs to answer, engineer a pipeline to clean and process that data, and build a high-impact visual dashboard that delivers the actual insights.